How I Use Claude in PowerPoint to Build Decks Faster
By Hafizh Yuwan Fauzan · 2026-09-29
Claude in PowerPoint is an add-in that puts Claude in a sidebar next to your deck and builds or edits slides in your own template. In my test, a six-slide monitoring deck for a credit risk committee went from rough notes to a complete first draft in about seven minutes. Building a deck like that by hand, from finding a template to getting the storyline aligned, can take me a full working day.
As a credit risk data scientist, I find the numbers are the quick part of my job. Pulling data with Spark, writing the SQL, getting the logic right: that goes fast because it is what I am trained for. Turning those numbers into slides a committee can follow is a different skill, and it is where the time used to go. The add-in doesn't do my analysis and it doesn't present for me. It takes on the slide-building, so I can spend my effort on the story.
This is a practical walkthrough: what the add-in is, how to set it up, three workflows I use, prompts you can copy, and where it still needs a human.
Key takeaways
- Claude in PowerPoint builds and edits slides inside your own template, with native, editable charts.
- A six-slide committee draft took about seven minutes; I still read every number and every sentence it added.
- Work in small steps: one slide, one change per request.
- Anthropic doesn't recommend it for final deliverables without human review, or for sensitive or regulated data without proper controls.
What Claude in PowerPoint is
Claude in PowerPoint is an add-in that opens Claude in a sidebar next to your deck. You describe what you want in plain language, and it works directly on your slides.
Three things make it different from pasting text into a chatbot and copying the answer back:
- It reads your template. Claude reads the slide master, layouts, fonts and colour scheme already in your deck and uses them when it creates or edits slides, so new slides look like they belong.
- It edits what you select. You can point it at one slide and ask for a change instead of regenerating the whole deck.
- It builds native content. Charts and diagrams come out as real, editable PowerPoint objects, not pictures. You can still click into a chart and change a number.
It is part of Claude for Microsoft 365, so the same conversation can also draw on what you have open in Excel, Word or Outlook. All product details in this article come from Anthropic's documentation for Claude for PowerPoint, checked in September 2026.
| As of September 2026 | |
|---|---|
| Plans | Pro, Max, Team and Enterprise (not Free) |
| Runs on | PowerPoint on the web; Windows with a Microsoft 365 subscription; Mac |
| Doesn't run on | PowerPoint on iPad or Android; PowerPoint 2016 and 2019 perpetual or volume licences |
Setting it up
- Open the Claude for Microsoft 365 listing on Microsoft AppSource and select Get it now.
- Open PowerPoint and activate the add-in: Home → Add-ins on Windows, or Tools → Add-ins on Mac.
- Sign in with your Claude account. The sidebar opens next to your deck.
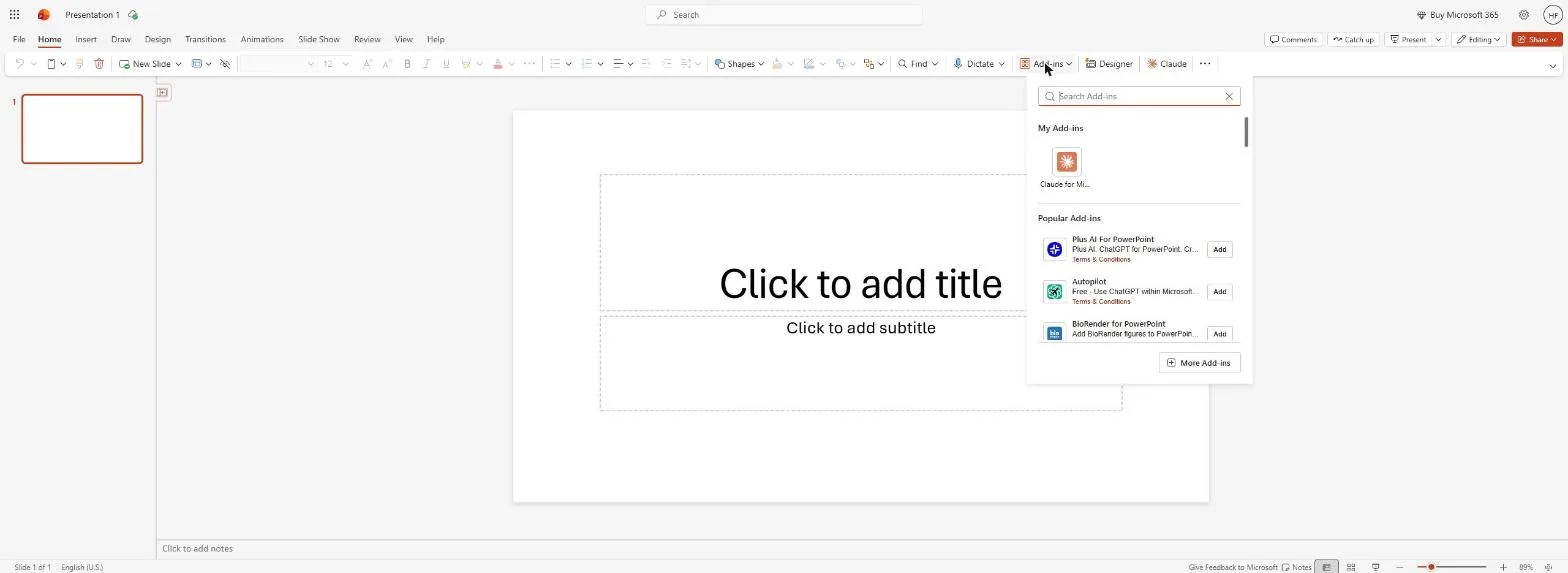
If you are at a company, ask your IT team first. Admins can deploy the add-in for everyone from the Microsoft 365 Admin Center, and some organisations block installing add-ins yourself.
Three workflows I use
To keep things concrete, every example below uses the same fictional deck: Monthly Scorecard Monitoring, October 2026. The numbers are made up: a population stability index (PSI) of 0.07, which measures how far this month's applicants have shifted from the ones the model was built on; a Gini of 0.61 against 0.63 at development, which measures how well the score separates good and bad borrowers; and an approval rate of 42%.
1. A first draft from rough notes
I start from our template and my notes, exactly as messy as they are. Instead of designing slides, I describe the deck I want.
Create a 6-slide monthly model monitoring deck from these notes.
Audience: credit risk committee, 15-minute slot.
Slides: title, key messages, population stability, discrimination,
approval rate trend, actions and next review.
Notes:
- PSI 0.07, stable (threshold 0.10)
- Gini 0.61 vs 0.63 at development, small drop, within tolerance
- Approval rate 42%, down from 45% last month
- Action: investigate the approval drop in the new-to-bank segment
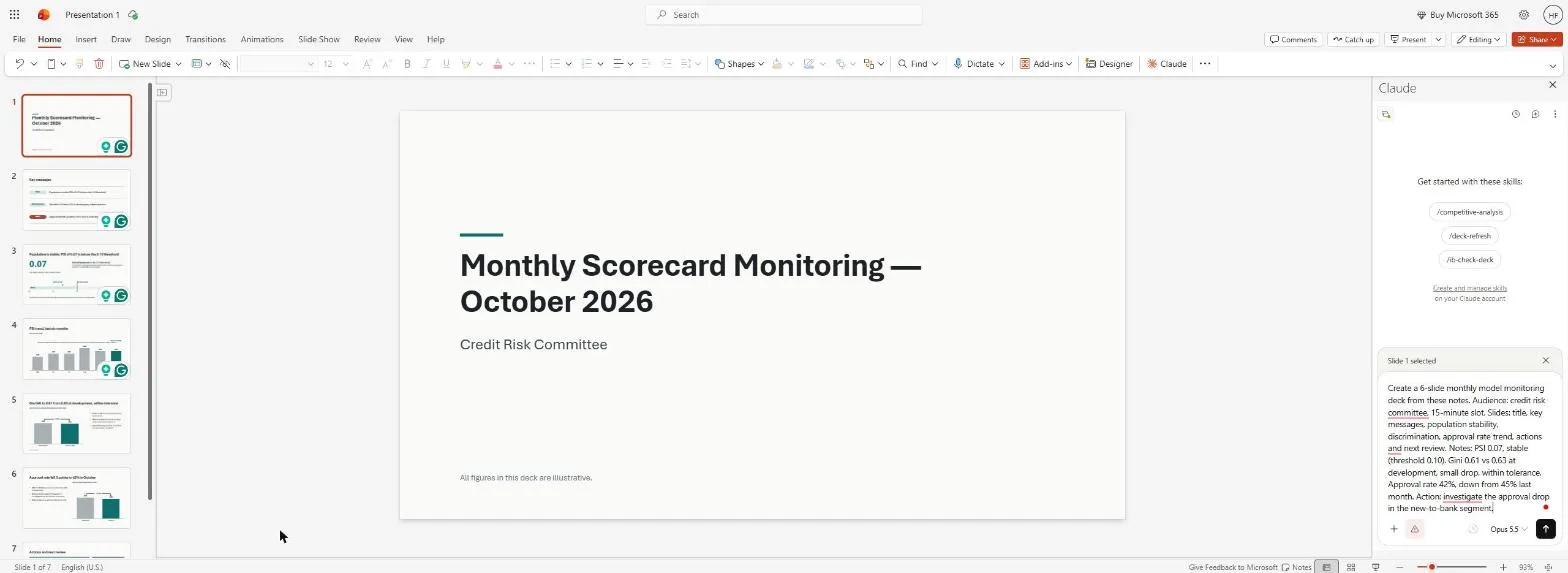
The prompt was retyped over the finished deck for this screenshot, which is why the slides are already visible.
What comes back is a structured draft in the deck's template. It is not final, but the skeleton, headings and first-pass wording are there.
From there, I iterate in the same conversation rather than starting over. "Make slide 2 lead with the approval-rate drop." "Merge slides 5 and 6." "Add a backup slide with the segment breakdown." Each follow-up builds on the draft, so after a few rounds the deck has my structure and my emphasis without my touching a text box.
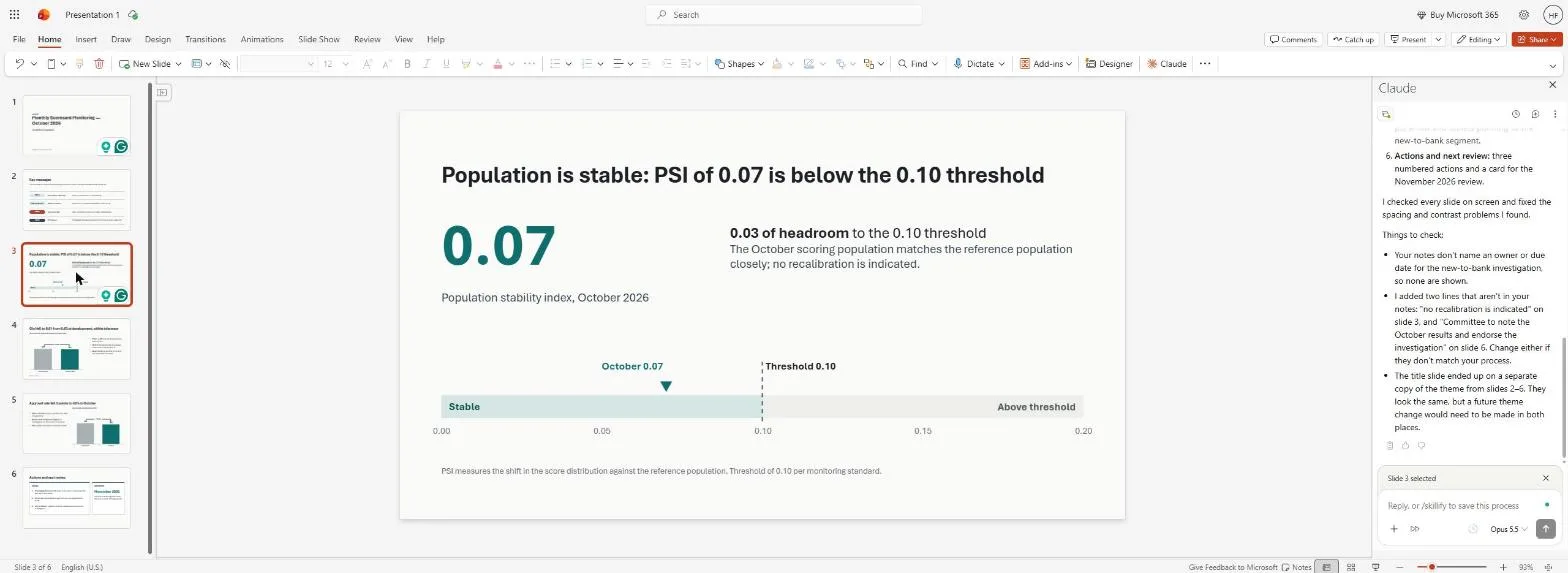
When the draft was done, Claude ended with a short "things to check" list. It included two sentences it had added that weren't in my notes, which is exactly what to read before the deck goes anywhere.
The draft was complete about seven minutes after I sent the prompt, including a few confirmation prompts, because the add-in asks before it edits your file. Claude then spent a couple more minutes checking its own slides.
What I still had to do: cut the key-messages slide down to three one-line points (one follow-up request, under two minutes) and read the two sentences Claude had flagged as its own. That makes about ten minutes from prompt to a deck I was ready to review. By hand, most of my day goes on finding inspiration, searching for the right template and getting the storyline aligned before the first slide exists.
Tip: give the audience and the time slot. "Risk committee, 15 minutes" produces tighter slides than "make a deck".
2. Pinpoint edits on one slide
Select a slide and ask for one specific change. Everything else in the deck stays as it is.
This slide is too dense. Keep the three key messages, cut each to
one line, and move the supporting detail into the speaker notes.
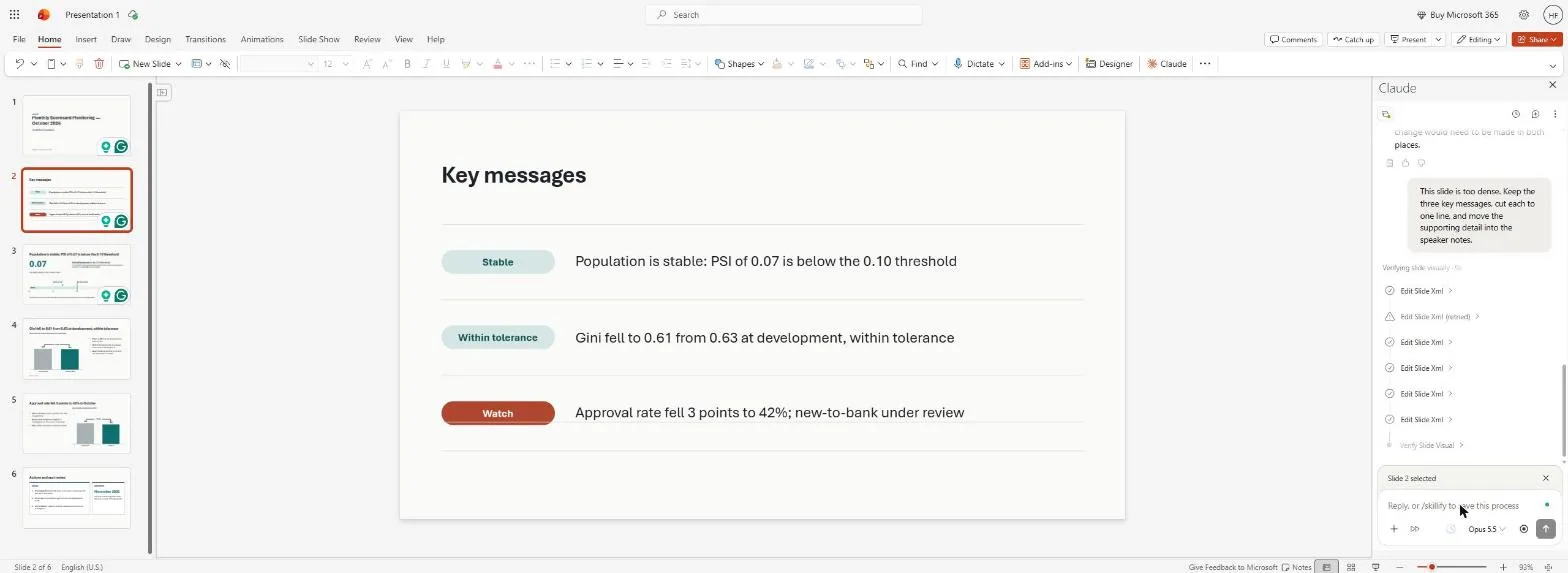
Other useful single-slide edits: "make the title an insight, not a label" and "reorder these bullets from most to least important".
Tip: one change per request. Small, specific asks are easier to check than "improve this slide".
3. Turning bullets into a chart
Monitoring decks are full of numbers that belong in a chart. I added a slide with six monthly PSI values as bullets: May 0.05, June 0.06, July 0.06, August 0.08, September 0.07 and October 0.07. Instead of building the chart by hand, I selected the slide and asked:
Turn these bullets into a native bar chart comparing PSI for the
last six months, with a dashed line at the 0.10 threshold.
Use the template colours.
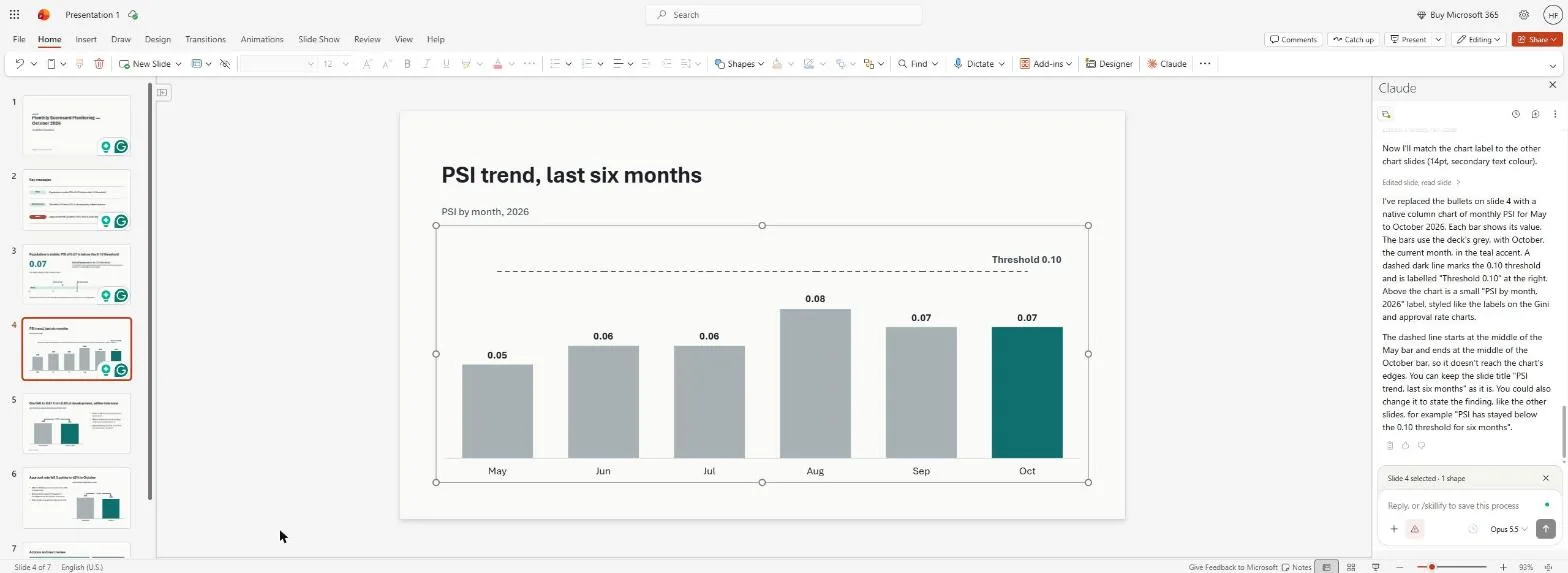
Because the chart is a real PowerPoint chart, I can open its data and correct a value in seconds. According to Anthropic's documentation, the same works for process flows: a request like "turn these five steps into a left-to-right process diagram" should give you an editable diagram, not an image.
Tip: check every number after a conversion. The chart is only as right as the bullets it came from. And the 0.10 PSI threshold is a common rule of thumb, not a universal standard; use your own institution's.
Staying on-brand, and what I want to try next
The simplest way to stay on-brand is to apply the right template before you ask for anything, because Claude builds from the slide master.
For rules that go beyond the template, the add-in has an Instructions field in its Settings. Whatever you put there applies to every PowerPoint conversation. For a monitoring deck, something like: "One-line bullets. Action titles. Numbers to two decimals. Use the accent colour only for the one figure that matters."
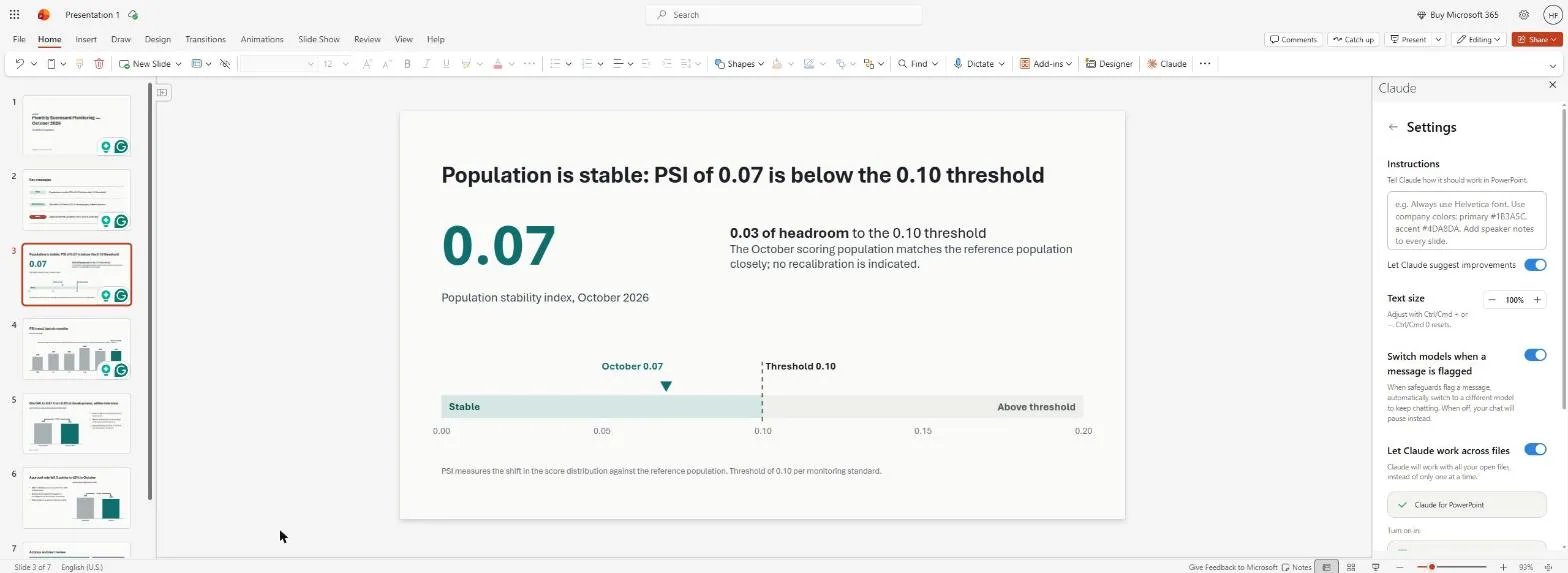
Everything in this article used the add-in as it comes, with no custom Skills. Skills are reusable task recipes that Anthropic added to PowerPoint in March 2026 (Anthropic). I haven't built one yet, but a deck rebuilt every month with new numbers is the obvious candidate: a recipe for "update this deck with this month's figures and flag anything that changed direction". That is the next thing I plan to try.
Tip: put style rules in Instructions once, instead of repeating them in every prompt.
Prompts you can copy
Draft a section
Add a 3-slide section on model performance: one slide per metric,
each with an action title, one chart, and at most three bullets.
Tighten a slide
Rewrite this slide so the title states the conclusion and the body
has no more than three one-line bullets.
Visualise
Convert this table into a native line chart of the monthly trend,
highlighting the latest month.
Restructure the storyline
Restructure the storyline across slides 3 to 5 so each slide
leads with its conclusion.
Reorder the deck
Reorder the deck to lead with recommendations, then the evidence,
then the appendix.
Executive summary
Create an executive summary slide that captures the three decisions
this committee needs to make, based on the slides in this deck.
Consistency check
Check every slide for numbers that don't match each other and list
any inconsistencies. Don't change anything yet.
Where it still needs a human
Anthropic's documentation says plainly that the add-in is not recommended for final client deliverables without human review, and I agree. My ground rules:
- Review every number and claim. Claude drafts fast; you are still the one presenting. Read every slide before it leaves your laptop.
- Keep sensitive data out unless your organisation has approved it. Anthropic doesn't recommend the add-in for highly sensitive or regulated data without proper controls. In credit risk that matters: the examples here use dummy numbers, and customer-level data should only go in if your company's rules allow it.
- Only use trusted files. Anthropic warns that files from external sources, such as downloaded templates or vendor decks, can contain hidden instructions aimed at the AI. When Claude proposes a risky action, it asks you to confirm first. Read those confirmations.
- Keep the judgement. It is good at structure and formatting. Deciding what the committee needs to hear is still your job.
How your data is handled
For anyone in a regulated industry, this is the first question. According to the same documentation, as of September 2026:
- Your chat history is stored locally in your browser, and you can clear it from Settings.
- Inputs and outputs are deleted from Anthropic's backend within 30 days, with some exceptions set out in Anthropic's data retention policy.
- The add-in does not inherit custom data retention settings your organisation may have set, and its activity is not included in Enterprise audit logs.
Check these points with your own risk and compliance team before putting anything real into a deck.
How to start this week
Claude in PowerPoint won't write your analysis. It removes the part of deck-building that was never analysis in the first place. Start small: apply your template, draft one section from your notes, and use single-slide edits for everything after that. Once that feels natural, move your style rules into Instructions. The numbers usually start life in a spreadsheet, so I also wrote up a full session with the Excel add-in: Claude in Excel, from a messy loan export to a risk dashboard. And to have the two add-ins work together, see Claude in Excel and PowerPoint, from portfolio data to a board deck.
I'm a credit risk data scientist at a credit bureau, and I also write about credit risk modelling. If scorecards themselves are new to you, my series on how credit scorecards work starts from the basics, and PSI and Gini each get their own part later on. And if you are trying Claude in PowerPoint in your own team, I would like to hear how it goes: get in touch.
Also published on Medium.
Hafizh Yuwan Fauzan (Hafizh Fauzan) is a credit risk data scientist in Jakarta, Indonesia, building scorecards and machine learning models on national-scale credit data.