How a Credit Scorecard Works: Points, Odds and Why Lenders Use Them
By Hafizh Yuwan Fauzan · 2026-09-29
Part 1 of 7 in a series on building credit risk scorecards.
I work at a credit bureau, and explaining scorecards to the credit, risk and data people at the companies we serve comes easily. We share the vocabulary, so a Gini or a bad definition needs no introduction. Explaining the same ideas to someone outside credit risk is a different story. I have caught myself giving explanations that felt awkward and not very convincing, because they leaned on terms I never stopped to unpack.
So I went back to the book that started it all for me, N. Siddiqi's Credit Risk Scorecards (Wiley, 2006), and I am breaking it down one section at a time, for readers who have never built a scorecard. I rebuilt my own refresher on it stage by stage, recreating every chart from a simulated portfolio of 40,000 applicants. This series turns that refresher into seven articles, all collected on my articles page, that follow the build in order, from planning to monitoring. All numbers in it are synthetic, so you can follow every calculation without touching real customer data.
A credit scorecard is one of the oldest statistical tools in lending that is still doing daily work. Every time someone applies for a loan or a credit card, there is a good chance a table of points decides, or at least shapes, the answer.
This first part covers the foundations: what a scorecard is, how its points turn into odds, where scorecards are used, why lenders still prefer points to a black box, and what has to be decided before anyone pulls data.
Key takeaways
- A scorecard gives each applicant points per characteristic; the total ranks applicants by their odds of repaying.
- A scaling rule ties points to odds. In this series, every 20 extra points doubles the good:bad odds.
- Application scorecards are just one type; behaviour, collections, bureau and fraud scorecards serve other stages of the credit life cycle.
- Points survive because anyone can read them: credit officers, risk managers, validators, regulators and IT.
- The build starts with a business plan and a team, not with data.
A scorecard is a table of points
A scorecard converts an applicant's characteristics into points, and the total ranks applicants by their odds of repaying. Each characteristic, such as age or credit utilisation, is split into ranges called attributes, and each attribute carries a fixed number of points.
Here is one applicant scored on the scorecard built in this series:
| Characteristic | Applicant's attribute | Points |
|---|---|---|
| Age | 30–34 | 84 |
| Time at address (months) | 24–59 | 94 |
| Revolving utilisation | 50–69% | 87 |
| Delinquencies, last 12 months | 0 | 99 |
| Credit inquiries, last 6 months | 1–2 | 90 |
| Residential status | Rent | 86 |
| Total | 540 |
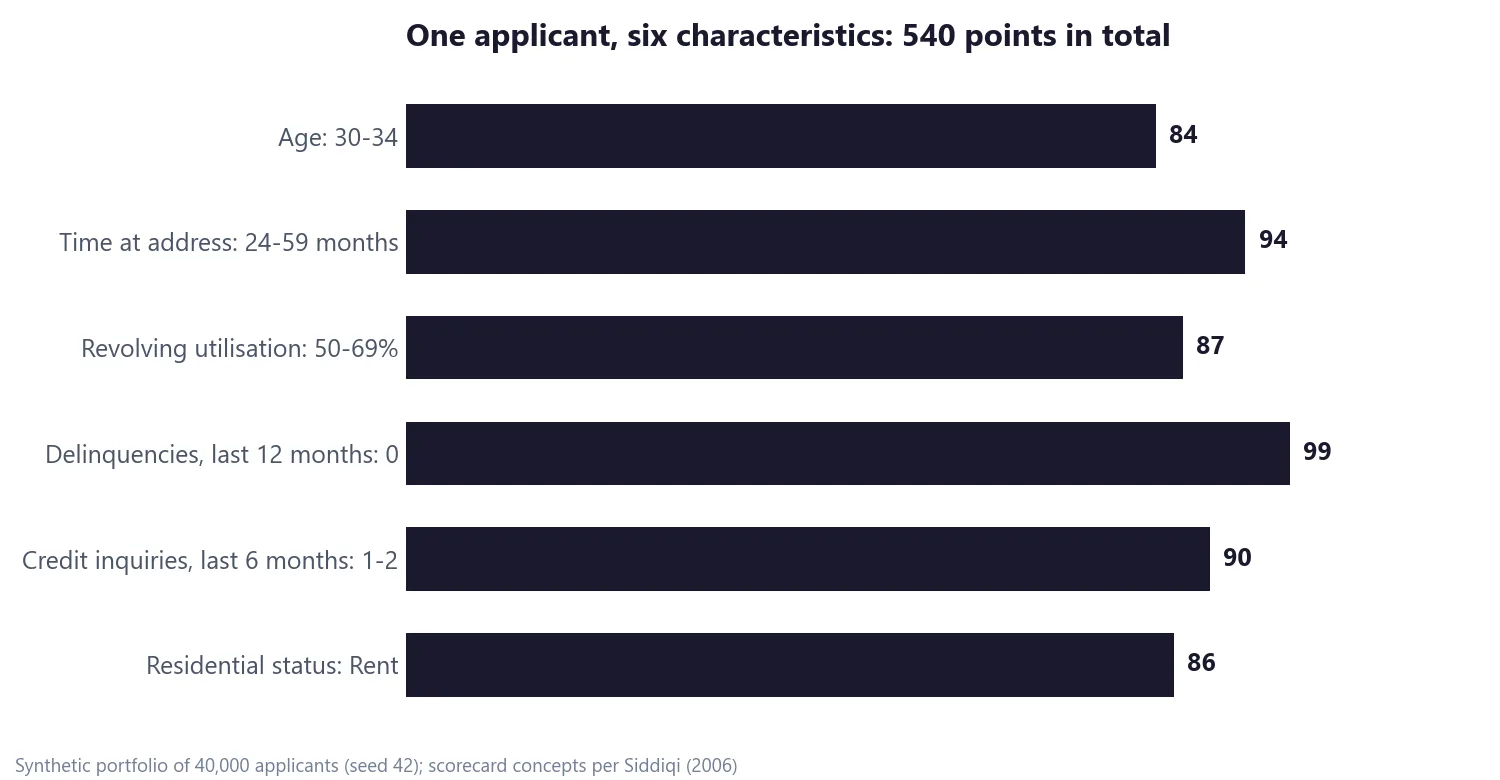
That is the whole mechanism from the applicant's side: find the attribute the applicant falls into, take its points, add them up. No model has to run at decision time. The statistics all happened earlier, when the points were set.
The ranges matter as much as the points. An applicant with no delinquencies in the last year gets 99 points for that characteristic; one with two or more gets 58. Differences like that across six characteristics are what spread applicants out, from 426 to 634 points on this scorecard.
From points to odds
First, what "bad" means. It is a defined outcome, typically an account reaching 90 or more days past due within a set period after the application date, called the performance window. That sits close to the regulators' default trigger of more than 90 days past due under the Basel framework. Everything else is "good". Choosing that definition carefully is the subject of Part 2.
A total score only means something once it is tied to odds. Scorecards do this with a scaling rule: a reference score is pinned to reference odds, and a fixed number of points doubles the odds. The scorecard in this series uses:
- 600 points = good:bad odds of 50 to 1
- 20 points to double the odds (PDO)
How those two numbers turn into points per attribute is covered in Part 5.
Under this rule, our applicant's 540 points correspond to odds of 6.25 to 1: for every 6.25 applicants like them who repay, one goes bad. Twenty more points, 560, means 12.5 to 1. At 600 it is 50 to 1.
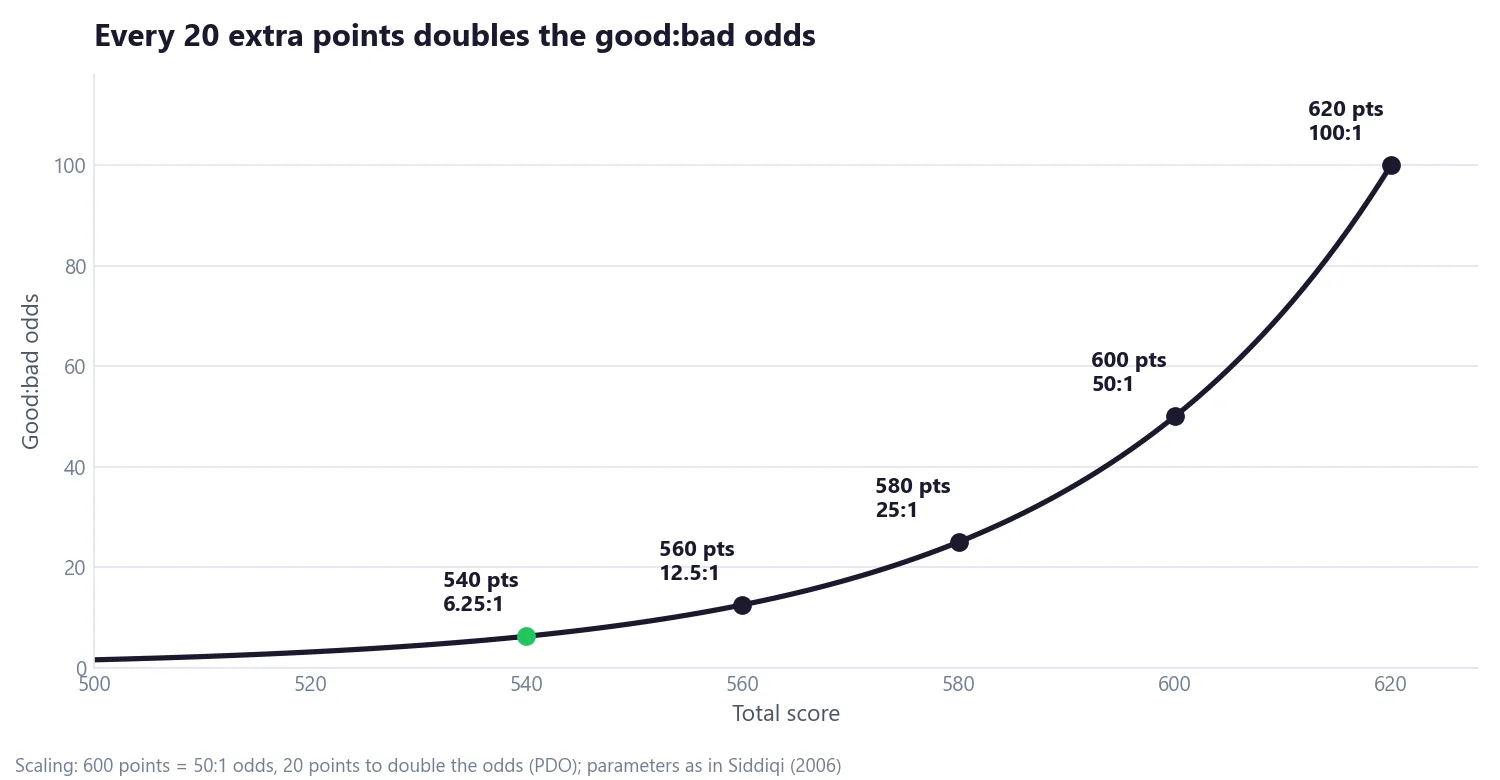
Odds convert directly into a probability of going bad: probability = 1 ÷ (1 + odds).
| Score | Good:bad odds | Probability of going bad |
|---|---|---|
| 540 | 6.25 : 1 | 13.8% |
| 560 | 12.5 : 1 | 7.4% |
| 600 | 50 : 1 | 2.0% |
Two things follow from this. First, a higher score always means higher estimated odds of repaying, so a lender approves applicants from the top of the score range down, and the question becomes where to stop (that is the cutoff, covered in Part 6).
Second, these probabilities are only as good as the model's calibration. The scaling says 600 points should mean 50 to 1, but whether it does for today's applicants has to be checked. Turning a score into a calibrated probability of default is its own step, which Part 7 comes back to.
Five kinds of scorecard
Scorecards serve every stage of the credit life cycle. The one this series builds is the application scorecard, used when a new customer asks for credit, but it helps to see the whole family:
| Scorecard type | When it is used | What it predicts | Main data |
|---|---|---|---|
| Application | A new applicant asks for credit | Probability of going bad within the performance window | Application form, credit bureau report |
| Behaviour | Existing accounts, usually monthly | Risk of an active account going bad; drives limits and renewals | Account payment and usage history |
| Collections | Accounts already delinquent | Likelihood of paying back or rolling further | Delinquency history, contact outcomes |
| Credit bureau (generic) | Any lender, off the shelf | Generic default risk across lenders | Pooled bureau data |
| Fraud and bankruptcy | At application or during the account's life | Specific events other than delinquency | Application data, transactions, bureau |
The build process is broadly the same for all of them. What changes is the data available, the definition of a "bad" outcome, and how often the score is used.
Why lenders still use points
With gradient boosting and neural networks available, it is fair to ask why so many lenders still decide with a table of points. The answer is that every point can be explained, to the business, the regulator and the customer. Under the hood, the points are a rescaled logistic regression (Part 3 fits the regression; Part 5 turns it into points), so this is still a statistical model; it is just one anyone can read.
The points format gives you:
- Transparency. Points are attached to named attributes and simply add up. Anyone can see what each characteristic contributes without statistical training.
- One artefact for the whole life cycle. The same table is used in development, in the decision system and in monitoring reports.
- A sense check before go-live. Each attribute's points can be compared with business intuition. If renters outscore homeowners, someone will ask why before a single application is decided.
And the business can act on it:
- Credit officers can tell a declined applicant the main reasons for the decision.
- Risk managers can trace a shift in scores back to the characteristic that moved.
- Validators and regulators can audit the model without re-running it.
- IT teams can implement it as a simple lookup table in any decision engine.
Explaining a decline is more than good manners. In the United States, for example, Regulation B (as of October 2026) requires that a statement of reasons for declining credit "must be specific and indicate the principal reason(s) for the adverse action". The Consumer Financial Protection Bureau has made clear that this applies in full to lenders using complex algorithms, including machine learning (CFPB Circular 2022-03, May 2022).
With a scorecard, the reasons are sitting in the table: the characteristics where the applicant scored furthest below a benchmark. The official commentary to Regulation B gives two examples of such a benchmark: the average score on each characteristic of applicants at or just above the minimum passing score, or of all applicants (Official Interpretation 9(b)(2)-5).
Before any data: Stage 1, planning
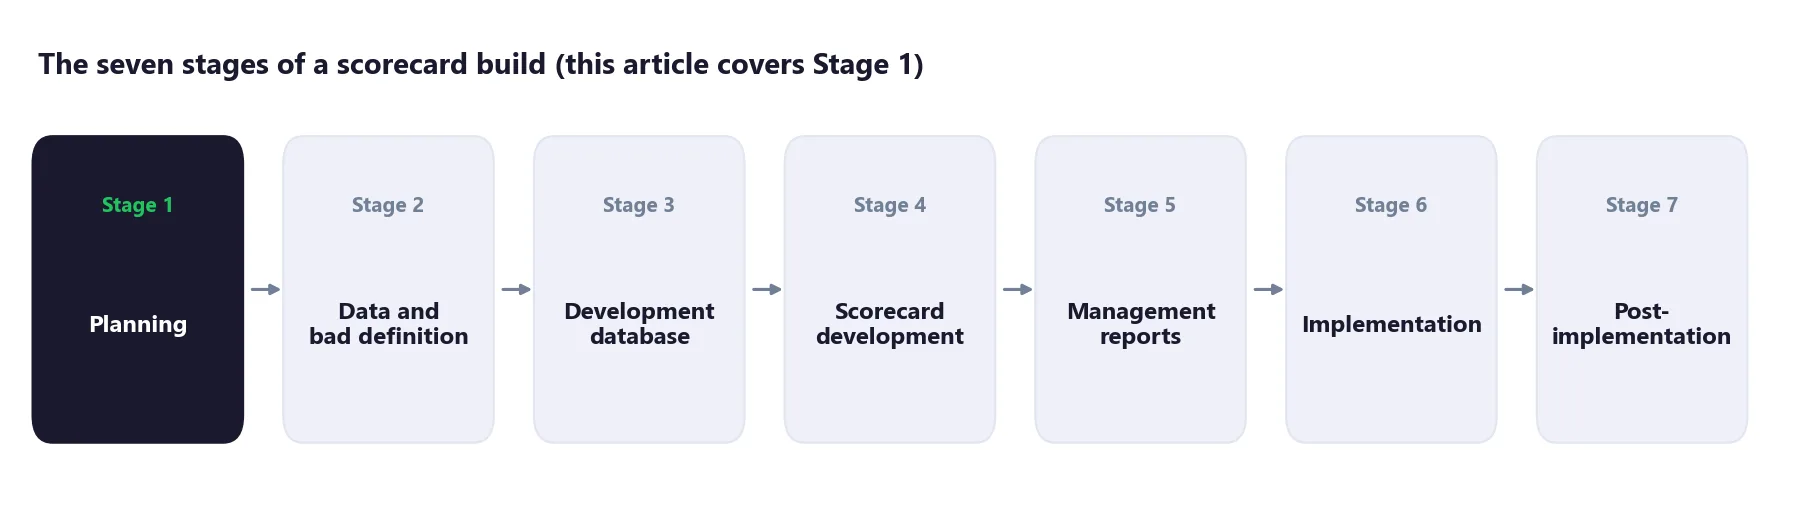
The seven-stage build this series follows starts with planning, not with data. The business objective, the project plan and the team are fixed first, because they decide everything downstream: what counts as a bad outcome, which applicants are in scope, and how the score will reach the decision system.
The team
A scorecard is not a one-person project. These are the roles involved and what each brings:
| Role | What the role contributes |
|---|---|
| Scorecard developer | Builds the data set and model; applies statistical judgement |
| Risk or credit scoring manager | Owns the bad definition, cutoffs and policy rules |
| Product manager | Brings target market, pricing and volume goals |
| Operations manager | Explains how applications are processed and overridden |
| Project manager | Keeps timeline and dependencies on track |
| IT and data managers | Confirm which data exist and can be deployed |
| Enterprise risk and legal | Check capital, regulatory and fair-lending rules |
The operations and IT roles are the easiest to leave out and the most expensive to miss. A characteristic that predicts well but is not captured at the point of application, or cannot be deployed in the decision engine, is worthless in production.
The decisions in the business plan
Before development starts, the plan should answer five questions:
- Objective. Is the scorecard meant to reduce losses, raise approvals, or price for risk? The answer shapes the cutoff strategy later.
- Development route. Build in-house, commission a vendor, or use a generic bureau score?
- Scope. Which product, channel and customer segments will the scorecard cover?
- Project risks. Missing data, too few bad accounts to model, late IT implementation.
- Implementation plan. How the score, cutoffs and reports will reach the decision system.
Writing these down sounds bureaucratic. In practice it is what stops a project from discovering, three months in, that the bad definition the model was built on is not the one the credit policy uses.
What comes next
The seven parts of this series follow the build in order:
- How a credit scorecard works (this article)
- Defining "bad": exclusions, sample and performance windows, vintages, roll rates and segmentation
- WOE, IV and logistic regression: turning raw characteristics into a model
- Reject inference: why a model built on approved applicants alone is too optimistic
- Scaling, KS, Gini and validation: points allocation, KS, Gini and out-of-time testing
- Cutoffs and strategy: gains tables, break-even odds and overrides
- After go-live: population stability, monitoring, and from score to expected loss
Part 2 starts where every real build gets difficult: deciding who belongs in the sample and what "bad" actually means.
The takeaway
A scorecard is a table of points that adds up to odds. Its strength is not that it beats every other model on accuracy, but that everyone who needs to trust it can read it. If you remember one thing from this part, make it the scaling: a reference score, reference odds, and a fixed number of points to double them. Every later stage builds on it.
If you work on scorecards too, I would like to hear how your team approaches them. Get in touch.
Also published on Medium.
Hafizh Yuwan Fauzan (Hafizh Fauzan) is a credit risk data scientist in Jakarta, Indonesia, building scorecards and machine learning models on national-scale credit data.