Characteristic Analysis for Credit Scorecards: Finding What Moved
By Hafizh Yuwan Fauzan · 2026-10-21
Stability deep dive 2 of 5: characteristic analysis. The first deep dive covered the population stability index (PSI) for the score as a whole; this one looks underneath it.
In month 9 after go-live, the score's PSI was 0.059. Against the usual 0.10 line, it looked stable. Against the noise zone from the first deep dive it was a real move, but it looked like one more step on a drift already under way: 0.027 in month 8, 0.047 in month 10. The first deep dive called it a wobble.
Underneath it, the share of applicants aged 18 to 24 went from 7.0% at development to 24.4%. The share with no delinquency in the last 12 months went from 75.7% to 91.0%. Both are large moves. Together they pulled the score in opposite directions, and about half of the effect cancelled out.
That is what characteristic analysis is for. Siddiqi puts it plainly: the PSI report "only indicates whether a shift has occurred, and gives an indication of the magnitude. For business decision making, finding out the source of the population shift is far more important" (Credit Risk Scorecards, 2006, p. 138).
The figures come from the same separate simulation as the first deep dive: monthly cohorts of 2,000 applicants for the fictional lender in Part 7 of the scorecard series, which went live at a 540 cutoff, scored with the scorecard from Part 5 and compared with the scorecard's 28,000-account development sample. They don't match Part 7's figures, which came from a different run.
Why I check CSI even when PSI is quiet
A common way to run monitoring is as a funnel: check PSI, and open the characteristics only if PSI flags. I don't work that way. I always look at the CSI, whatever happens to the PSI. It is a parallel process, not a sequential one.
Month 9 shows why. A scorecard score is a sum of points. When one characteristic takes points away and another adds them back, the sum barely moves, and PSI is measured on the sum. The funnel only catches shifts that survive the addition, so the ones that cancel are the ones it is most likely to miss.
The characteristic analysis table
Siddiqi's characteristic analysis report "provides information on the shifts in the distribution of scorecard (and other) characteristics, and the impact on the scores due to that shift" (p. 139). For each attribute, it puts the development share (expected) next to the recent share (actual) and multiplies the difference by the attribute's points:
Points shift = Σ ( actual % − expected % ) × points (over the characteristic's attributes)
The shares go in as proportions (0.244, not 24.4%), as in PSI. Here is age in month 9, with the points from the Part 5 scorecard:
| Age | Expected % | Actual % | Points | Shift (Siddiqi) | Shift, centred |
|---|---|---|---|---|---|
| 18–24 | 7.0% | 24.4% | 68 | +11.81 | −4.68 |
| 25–29 | 14.9% | 17.2% | 77 | +1.82 | −0.42 |
| 30–34 | 17.8% | 16.8% | 84 | −0.92 | +0.12 |
| 35–44 | 30.4% | 23.1% | 95 | −6.95 | −0.01 |
| 45–54 | 16.9% | 10.4% | 111 | −7.18 | −1.04 |
| 55+ | 13.0% | 8.1% | 124 | −6.02 | −1.41 |
| Total | −7.44 | −7.44 |
Applicants scored 7.4 points less on age than at development. Siddiqi's own Exhibit 8.2 shows the same pattern on a smaller scale: a shift toward younger applicants, worth 2.63 points.
The totals have one property that makes the table worth the effort: they add up. Across the six characteristics, month 9's points shifts sum to −5.59, and the mean score fell from 558.97 at development to 553.37, also −5.59. That is not an approximation. The score is a sum of points, so the change in its average is the sum of the changes per characteristic. With 20 points to double the odds, 5.6 points is a little over a quarter of a doubling.
Why the raw rows mislead
In Siddiqi's form, the 18–24 row shows +11.81, even though young applicants score the fewest points. That sign comes from multiplying by raw points: any group that grows adds its full 68 points to the sum. The cost shows up in the shrinking rows, each of which removes its own, larger points.
The last column fixes that by subtracting the characteristic's average development points (94.9 for age) before multiplying. The total stays at −7.44, because the shares always add to 100%, but each row now reads the way you'd expect: the influx of 18 to 24 year olds costs 4.7 points, and the shrinking 45+ groups cost another 2.5.
CSI: how far one characteristic moved
The characteristic stability index (CSI) is PSI applied to one characteristic, using its attributes instead of score bands:
CSI = Σ ( actual − expected ) × ln( actual ÷ expected ) (over the characteristic's attributes)
Siddiqi's Exhibit 8.2 doesn't include it: its Index column is the points shift. I read both, because they answer different questions. CSI says how far the distribution moved, with no direction. The points shift says which way the score moved and by how much, but a small, fast-growing group can hide inside it.
| Month 9 | CSI | No-change level | Points shift |
|---|---|---|---|
| Age | 0.295 | 0.003 | −7.44 |
| Delinquencies, last 12 months | 0.199 | 0.001 | +3.79 |
| Revolving utilisation | 0.062 | 0.003 | −1.52 |
| Time at address | 0.007 | 0.003 | −0.26 |
| Residential status | 0.005 | 0.002 | −0.16 |
| Credit inquiries, last 6 months | 0.000 | 0.001 | 0.00 |
The no-change level is the yardstick from the first deep dive, (groups − 1) × (1 ÷ 2,000 + 1 ÷ 28,000): roughly the CSI you'd expect from sampling alone. Age is about 110 times its level. Delinquencies are nearly 190 times theirs, yet worth only 3.8 points.
The two measures disagree in useful ways. Delinquencies have the second-highest CSI, mostly from the group with one delinquency shrinking from 21.1% to 8.6%, while the 2+ group almost vanished (3.3% to 0.4%). Inside revolving utilisation, the 90%-and-over group more than doubled, from 0.9% to 2.1%. That costs just 0.35 points (centred) and adds 0.011 to the CSI. Neither number shouts, and the row is still worth a look.
The same caveat as for PSI applies to CSI thresholds. The 0.10 and 0.25 lines are a rule of thumb (where they come from), and the level that matters depends on the scorecard type.
Reading the characteristics together
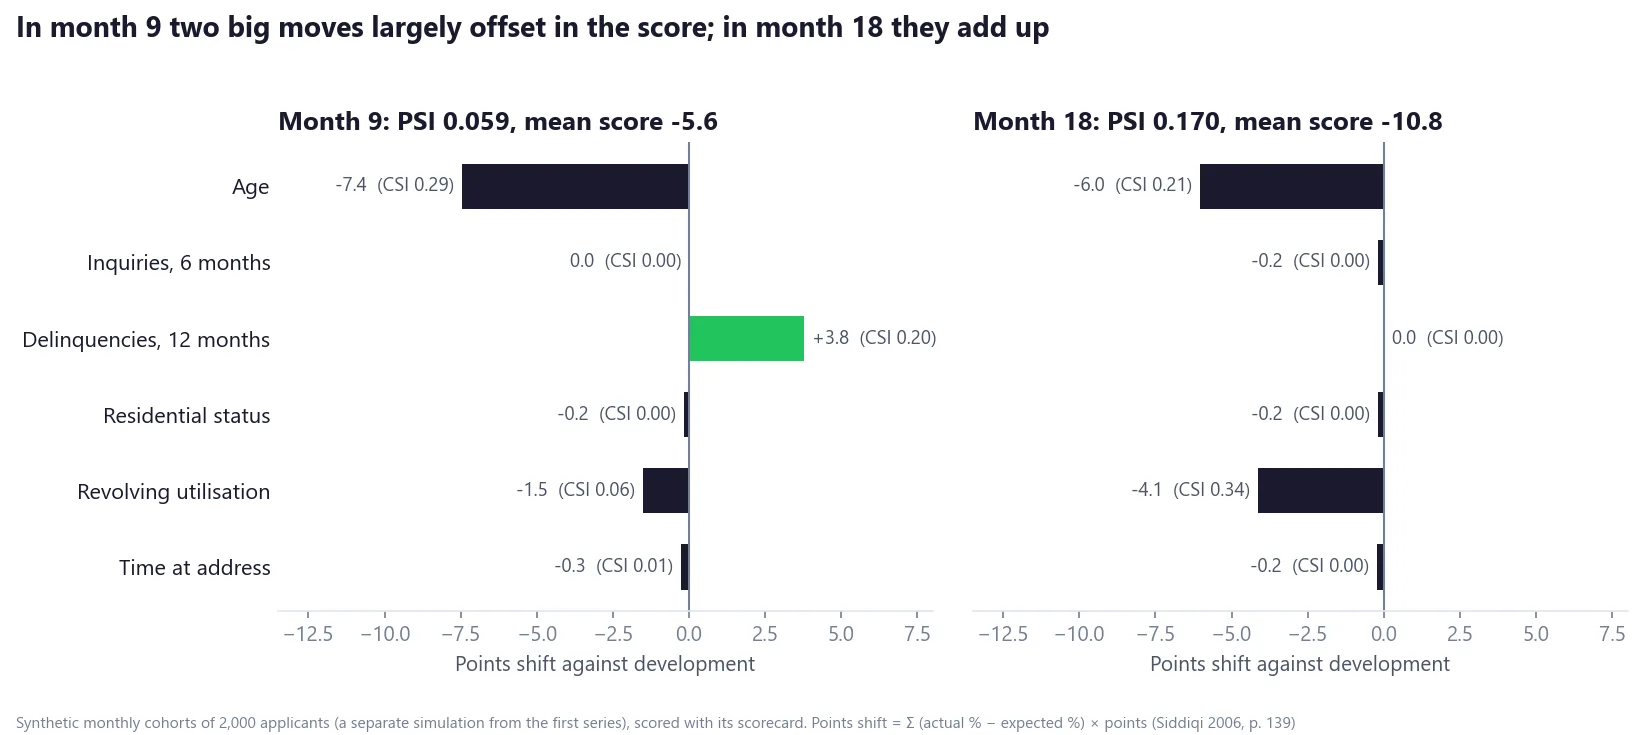
Month 9 and month 18 look nothing alike once the characteristics sit side by side.
In month 18 the shifts point the same way: age costs 6.0 points and revolving utilisation 4.1 (CSI 0.21 and 0.34). The mean score is 10.8 points down and PSI is 0.170. This is the slow drift from the first deep dive, and PSI sees it because nothing cancels.
Month 9 is different in two ways. The moves cancel, and part of them doesn't last. The delinquency CSI is back to 0.00 in month 10; age falls to 0.07, back onto the slow drift it was already on. A one-month spike in who applies is what a campaign looks like. Siddiqi lists exactly this: "if the recent month's applicants were noticeably younger or were concentrated in a particular area, this may be due to focused marketing activity" (p. 138).
The question I'd ask next is whether the two moves make sense together. Siddiqi's test is that shifts "should be consistent and explainable using logic and business considerations. If, for example, analysis shows that applicants are getting younger, yet have higher 'time at employment,' coding errors may be occurring" (pp. 140–141). Younger and cleaner is not illogical, but it has a second reading. A 20-year-old has had fewer months of credit in which to fall behind. Zero delinquencies can mean a good payer or a thin file.
Characteristics outside the scorecard can tell the two apart. Siddiqi suggests tracking related ones, such as age of the oldest trade next to age, and the numerator and denominator of any ratio (p. 140). Utilisation can fall because balances fall or because limits rise, and those mean different things. In this simulation age and delinquencies were drawn independently, so the data can't settle the thin-file question. In a real portfolio, that is the check to run before calling the month good news.
The Missing group: big news, small numbers
The shift that characteristic analysis is worst at catching is a rising Missing group.
In month 9, applicants with no time at address recorded went from 3.8% to 4.2%. That's nothing to worry about. But suppose a form change or a broken data feed had doubled it to 7.6%. I ran that as a what-if on the same development sample: CSI 0.028, points shift −0.36. Against a 0.10 line, both are invisible. The CSI is about ten times its no-change level, so the noise check would catch it, but only if someone divides. The points shift really is quiet. Missing is a small group, so even doubling it moves CSI little. And the scorecard gives Missing 83 points, the same as 0 to 11 months and only nine points below the characteristic's development average of 92, so the score barely notices.
A doubling of Missing almost never means applicants changed. It usually means the data did, which is one of Siddiqi's causes of a shift: errors in coding and data capture (p. 138). So I track the missing rate of every characteristic as its own line, next to the CSI, not inside it. (Why Missing deserves its own group in the first place is in the first binning deep dive.)
A monthly checklist
Run this alongside the score PSI, every month, not after it:
- Points shift per characteristic. Check that they add up to the change in mean score; if they don't, something is wrong in the report itself.
- Opposite signs. Two large shifts in opposite directions under a quiet PSI are worth a sentence in the report, even when nothing else is.
- CSI against its noise level. Divide by (groups − 1) × (1 ÷ recent + 1 ÷ development) before judging the size.
- Small groups that grew fast. Scan the rows, not only the totals; a group that doubles can hide in both measures.
- Missing rates on their own line. A jump is usually a data problem; the points shift won't show it, and the CSI shows it only against its noise level.
- One month or a trend? Compare with the previous three and six months before calling it a shift.
- Does it make sense together? Check related and non-scorecard characteristics, and the parts of any ratio.
The next deep dive moves from applicants to outcomes: out-of-time validation, and why it is always old by the time you read it.
If you read characteristic shifts in a different order, I would like to hear how. Get in touch.
Hafizh Yuwan Fauzan (Hafizh Fauzan) is a credit risk data scientist in Jakarta, Indonesia, building scorecards and machine learning models on national-scale credit data.