Setting a Scorecard Cutoff: Gains Tables, Break-Even Odds and Strategy
By Hafizh Yuwan Fauzan · 2026-10-04
Part 6 of 7 in a series on building credit risk scorecards. Part 5 turned the model into a points table and showed it ranks risk well.
Approve every applicant scoring 540 or more and you accept 78% of them, with 6.5% going bad. Raise the bar to 555 and you accept 58%, with 5.0% going bad. Which is the right cutoff?
Neither, on its own. A scorecard only ranks applicants; the cutoff is a business decision about how much risk to take for how much volume. This part covers the tools for making that decision well: the gains table, the trade-off curve, break-even odds, score-band strategy and overrides.
The numbers come from the 12,000-account holdout sample of the simulated portfolio used throughout the series, built for my refresher on N. Siddiqi's Credit Risk Scorecards (Wiley, 2006). Because the data is simulated, every applicant has a known outcome; on real data, a through-the-door gains table (one covering every applicant, approved or not) uses the inferred goods and bads for declined applicants from Part 4.
The gains table: what each band delivers
The gains table is the scorecard report a credit committee reads first. It shows, band by band from the best scores down, how many applicants fall in each band, how many go bad, and what you get cumulatively if you approve from the top down to that band.
| Score band | Accounts | Bad rate | Odds (good:bad, x to 1) | Cumulative % approved | Cumulative bad rate |
|---|---|---|---|---|---|
| 620+ | 67 | 1.5% | 66.0 | 0.6% | 1.5% |
| 600–619 | 679 | 1.8% | 55.6 | 6.2% | 1.7% |
| 580–599 | 1,999 | 2.7% | 36.7 | 22.9% | 2.4% |
| 560–579 | 3,107 | 5.6% | 16.9 | 48.8% | 4.1% |
| 540–559 | 3,515 | 10.6% | 8.4 | 78.1% | 6.5% |
| 520–539 | 1,855 | 19.4% | 4.2 | 93.5% | 8.7% |
| 500–519 | 622 | 30.4% | 2.3 | 98.7% | 9.8% |
| <500 | 156 | 47.4% | 1.1 | 100.0% | 10.3% |
Read the 540–559 row as: a cutoff at 540 approves 78.1% of applicants, and 6.5% of those approved will go bad. The band itself runs at 10.6%, but it is averaged with the safer bands above it. Each band's own bad rate is the one that matters for the next decision: lowering the cutoff from 540 to 520 adds applicants who go bad at 19.4%.
Every cutoff is a trade-off
Plot the cumulative columns against each other and the trade-off becomes visible:
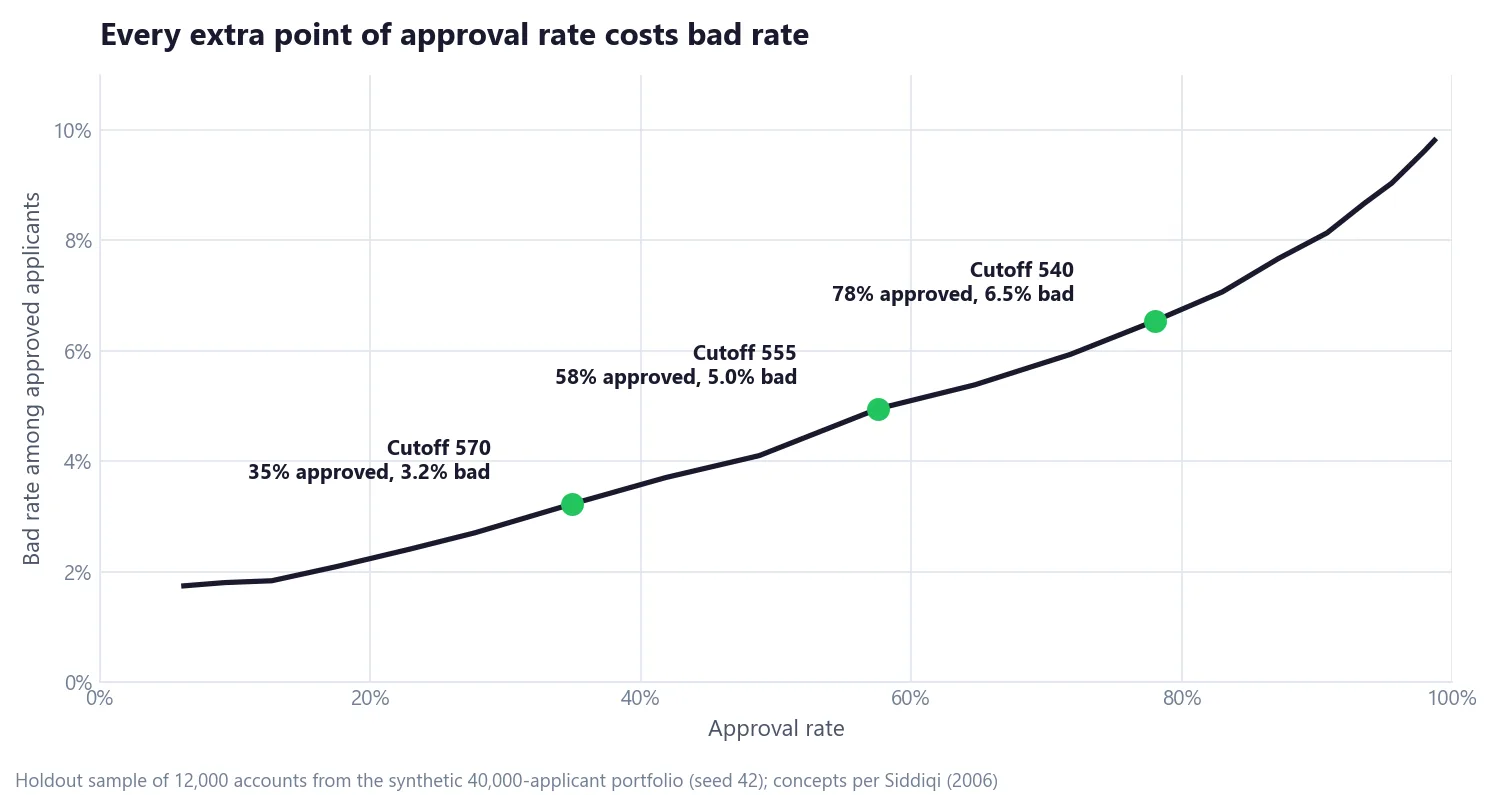
Moving the cutoff down the score range always buys approvals with bad rate. The curve steepens at the right-hand end because the last applicants approved are the riskiest. There are four common ways to choose a point on it:
- Target a bad rate. Pick the lowest cutoff whose approved bad rate stays within risk appetite.
- Target an approval rate. Pick the cutoff that delivers the volume the business plan needs.
- Target profit. Set the cutoff where one more approval just breaks even (next section).
- Hold one and improve the other. Keep today's approval rate and lower the bad rate, or keep today's bad rate and raise approvals. This is the usual case for replacing an old scorecard, analysed with a swap set (who the new score approves that the old one declined, and vice versa).
In a proof of concept: agree what success means first
At the bureau where I work, when a lender runs a proof of concept to test the bureau's score, the first thing I do is agree the success metric with them. Is the goal to raise the approval rate, to cut the bad rate, or both? Everyone wants both. In real cases that is hard to come by.
Siddiqi's book gives the framework (pp. 148–149). Compare the new score with the old one at two key cutoffs: the one that keeps today's approval rate, which tells you the new bad rate, and the one that keeps today's bad rate, which tells you the new approval rate. He notes that companies without a specific objective typically choose a cutoff between those two points, where there is both a gain in approval rate and a decrease in bad rate. It follows that this window only opens if the new score ranks risk better than the old one, and that a modest improvement leaves a narrow window. Agreeing upfront which side matters most is what turns a proof of concept into a clear yes or no.
Break-even odds: the profit-based cutoff
The profit approach asks a simple question: at what odds does one more approval stop paying for itself? If one bad loses more than one good earns, you need several goods per bad just to break even:
Break-even odds = loss per bad / profit per good
Cutoff          = Offset + Factor × ln(break-even odds)
With illustrative loan economics:
| Item | Value |
|---|---|
| Loss per bad = LGD 45% × exposure IDR 100,000,000 | IDR 45,000,000 |
| Profit per good account | IDR 4,500,000 |
| Break-even odds = 45,000,000 / 4,500,000 | 10 : 1 |
| Cutoff = 487.12 + 28.854 × ln(10) | 553.6 points |
The 487.12 and 28.854 are the scaling Offset and Factor from Part 5. LGD (loss given default) is the share of the exposure lost after recoveries; Part 7 returns to it. Applicants scoring above about 554 have predicted odds better than 10 to 1, so on average each one adds profit. Rounding up to a cutoff of 555, the holdout approves 57.6% of applicants at a 5.0% bad rate. Pricing moves this point too: a higher rate raises the profit per good, which lowers the break-even odds and the break-even cutoff with them.
Check it against the gains table
The 540–559 band has observed odds of 8.4 to 1, below the 10 to 1 break-even. That doesn't mean the scaling is wrong. The break-even cutoff of 554 falls inside that band, so the band mixes applicants below break-even (540–553) with applicants above it (554–559).
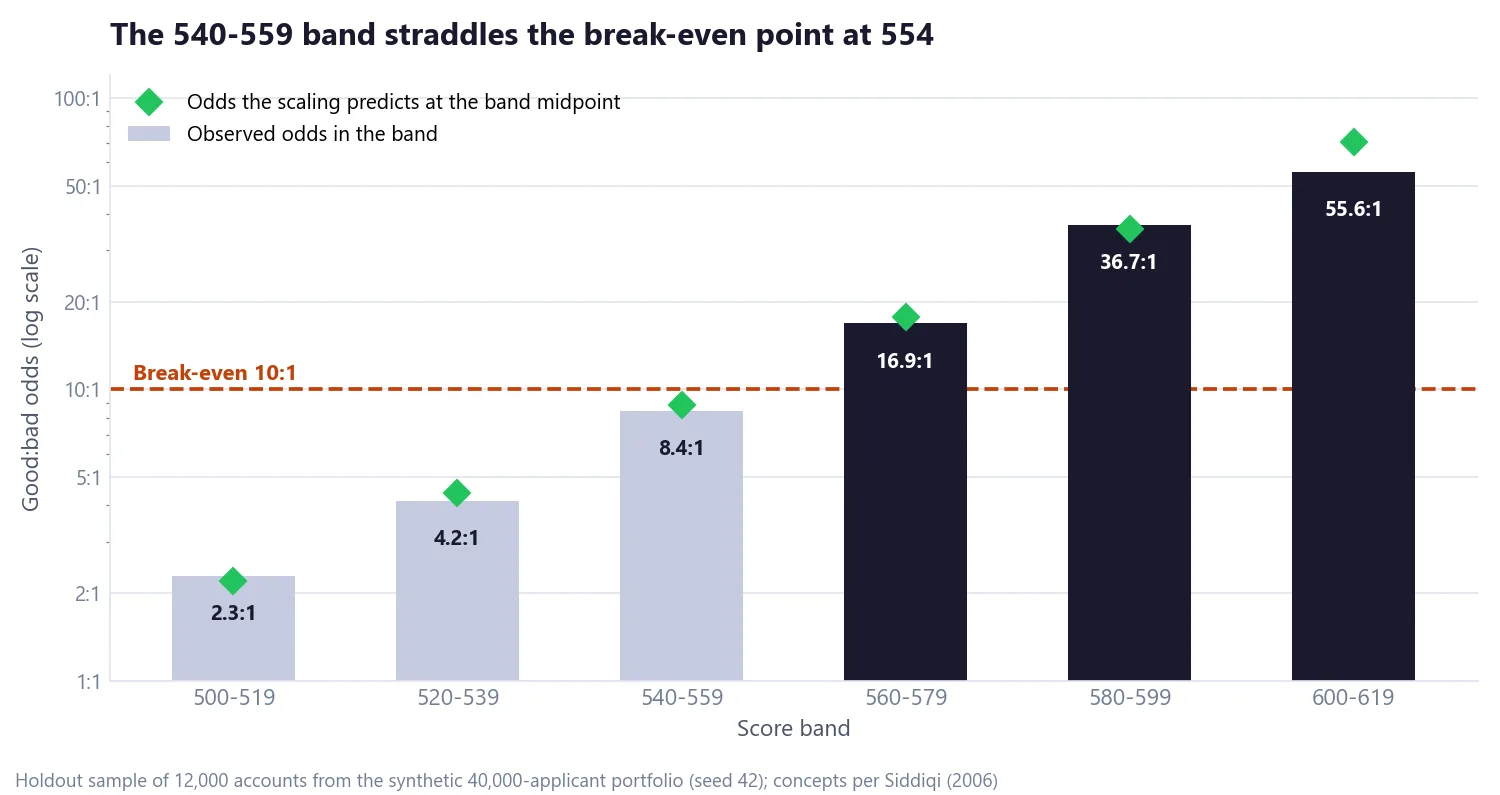
The chart also checks the scaling itself. In each band from 500 to 599, the observed odds sit close to what the scaling predicts at the band's midpoint (8.4 against 8.8 for 540–559, for example). The 600–619 band is noisier, because it holds only 12 bads. When you set a profit-based cutoff on real data, this check matters: if observed odds drift away from the scaled odds, the break-even score moves with them, which is the calibration problem Part 7 picks up.
Beyond approve or decline: score-band strategy
The score is more useful as a dial than a switch. The same bands can set credit limits, pricing and how much verification an applicant needs:
| Score band | Decision | Initial credit limit | Pricing | Verification |
|---|---|---|---|---|
| 600 and above | Approve | High | Lowest rate tier | Minimal |
| 570–599 | Approve | Standard | Standard rate | Standard |
| 555–569 | Approve | Reduced | Risk-based premium | Income verification |
| 540–554 | Refer to underwriter | Low, if approved | Highest rate tier | Full documentation |
| Below 540 | Decline | – | – | – |
Because the bands are cut from the same holdout, each band's expected bad rate can be read from a finer-grained gains table before go-live. The referral band sends marginal cases to people instead of straight to a decline. Bands like these should be agreed with operations, marketing and collections before implementation, not handed to them afterwards.
Risk-based pricing in Indonesia
In my work with Indonesian lenders, pricing by score band is common, especially at digital banks and fintech lenders, and each type of lender works under its own rules.
- Banks publish a base lending rate (suku bunga dasar kredit, SBDK), but it excludes the risk premium, which varies by debtor, so the rate a borrower actually pays generally differs from it (Bank Indonesia assessment, March 2026, citing POJK 13/2024). The risk premium is where a score band shows up in the price.
- Online lending platforms price within caps that OJK sets by loan type and tenor. For consumer loans, the maximum daily economic benefit (interest, fees and other charges, excluding late fees, stamp duty and tax) is 0.3% for tenors up to six months and 0.2% beyond that, per OJK's announcement of 31 December 2024, effective 1 January 2025 (OJK press release); check OJK for any later changes.
So the same score-band idea produces different pricing grids depending on who the lender is and which rules apply to it.
Policy rules and overrides
Two kinds of decisions sit on top of the score: policy rules and overrides, which come in two directions.
| Type | Definition | Example |
|---|---|---|
| Policy rule | A hard rule applied regardless of score | Decline applicants under the legal age or with an active bankruptcy |
| Low-side override | Approved although the score is below the cutoff | A long-standing customer with a strong relationship |
| High-side override | Declined although the score is above the cutoff | Adverse information the scorecard doesn't capture |
Overrides are healthy in small numbers. Tracked over time, they also show whether people trust the score:
Low-side override rate  = approved below cutoff / all applicants below cutoff
High-side override rate = declined above cutoff / all applicants above cutoff
Track how overridden accounts actually perform against what the score predicted. A rising override rate is a warning that underwriters have stopped trusting the score or the strategy, and that judgement is quietly replacing the model.
A cutoff decision memo you can copy
Before a cutoff goes to committee, I would want these answered on one page:
Objective:          [higher approvals / lower bad rate / both / profit]
Success metric:     [e.g. bad rate ≤ X% at approval rate ≥ Y%]
Proposed cutoff:    [score]  → approval [ ]%, bad rate [ ]% (gains table, holdout)
Current policy:     approval [ ]%, bad rate [ ]%  (same applicants, old score)
Break-even check:   loss per bad [ ], profit per good [ ], break-even odds [ ]:1
Score bands:        [limits, pricing, verification, referral band]
Policy rules:       [hard declines applied before the score]
Override limits:    [who may override, and how overrides are reported]
Review date:        [when approval and bad rates will be checked against forecast]
Earlier parts, in order: how a scorecard works, defining "bad", WOE, IV and logistic regression, reject inference and scaling, KS and Gini. Part 7, the last one, covers what happens after go-live: stability, monitoring, and turning the score into a probability of default and expected loss.
If you have run a scorecard proof of concept, I would like to hear which success metric you agreed on: get in touch.
Hafizh Yuwan Fauzan (Hafizh Fauzan) is a credit risk data scientist in Jakarta, Indonesia, building scorecards and machine learning models on national-scale credit data.